Kusto Queries on AKS Clusters

Kusto query language can be used to get insights into Azure Kubernetes Service (AKS) clusters. Container insights collects data from AKS clusters and forwards it to Log Analytics workspace, if enabled for a cluster. This data is available for querying in the Azure Monitor. Here is an example of how you can query the pods not in running state in specific namespaces. 

KubePodInventory 
| where Namespace in ("dv","test","prod") 
| where ContainerStatus != "Running" 
| where ContainerStatusReason !in ("", "Completed") 
| distinct Namespace, Name 
Run 
Time range : Last 24 hours 
E] Save v 
14 Share v 
1 
2 
3 
4 
5 
KubePodInventory 
I where Namespaceän ('dv', 'test', 'prod') 
I where ContainerStatusu != 
"Running" 
I where ContainerStatusReasone ! in ('I", "Completed") 
I distinct Namespace, Name 
Results Chart 
@ Display time (UTC+OO:OO) v 
Columns v 
Completed. Showing results from the last 24 hours. 
> 
Namespace 
dv 
prod 
Y Name Y 
app2 
app2

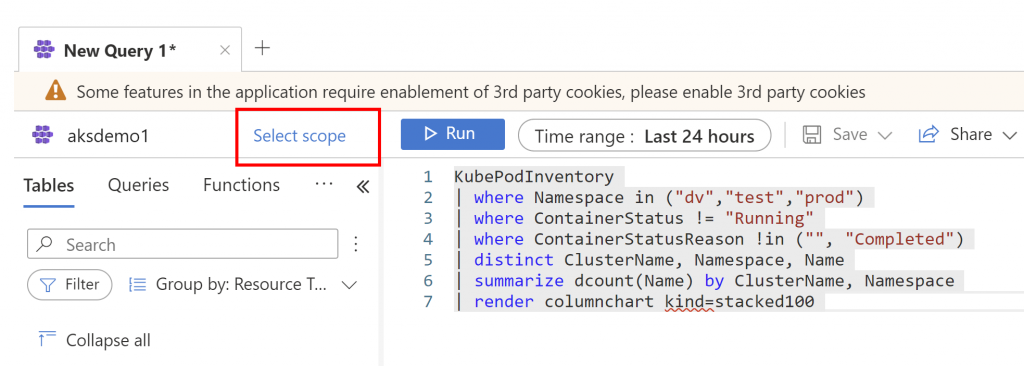
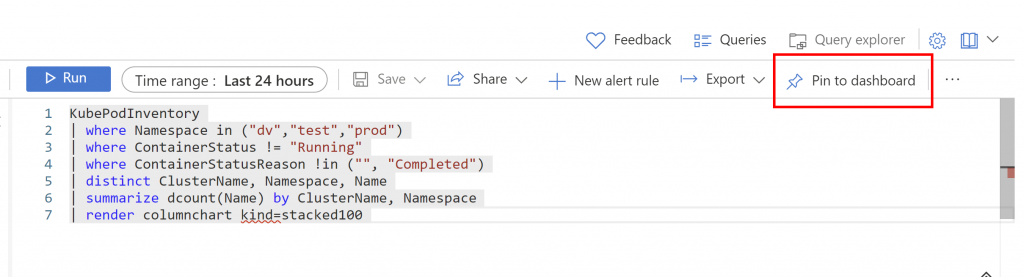
The following query includes the name of the AKS cluster and renders the output as a stacked bar chart.

KubePodInventory 
| where Namespace in ("dv","test","prod") 
| where ContainerStatus != "Running" 
| where ContainerStatusReason !in ("", "Completed") 
| distinct ClusterName, Namespace, Name 
| summarize dcount(Name) by ClusterName, Namespace 
| render columnchart kind=stacked100 
Run 
Time range : Last 24 hours 
E] Save v 
14 Share v 
+ New alert rule 
Export v 
Pin to dashboard 
1 
2 
3 
4 
5 
6 
7 
8 
KubePodInventory 
I where Namespace in ('dv', 'test', 'prod') 
I where ContainerStatus ! = 
"Running" 
I where ContainerStatusReason ! in ('I", "Completed") 
I distinct ClusterName, Namespace, Name 
summarize dcount(Name) by ClusterName, Namespace 
render columnchart kind=stacked100 
Results 
Chart 
@ Display time (UTC+OO:OO) v 
Completed. Showing results from the last 24 hours. 
00:00.7 
2 records 
z 
o 
100 
50 
dv 
O 
aksdemol 
ClusterName 
prod 
Activate Windows 
Go to Settings to activate Windows.

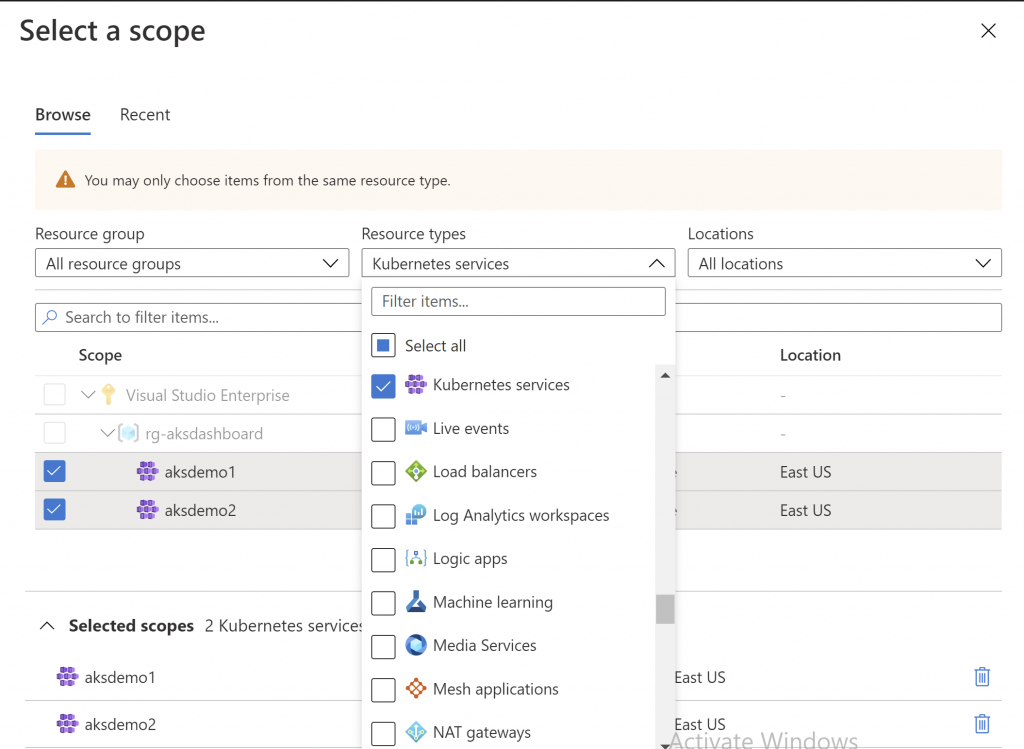
You can include multiple AKS clusters in the scope in which this query is executed by clicking on [Select scope] hyperlink.


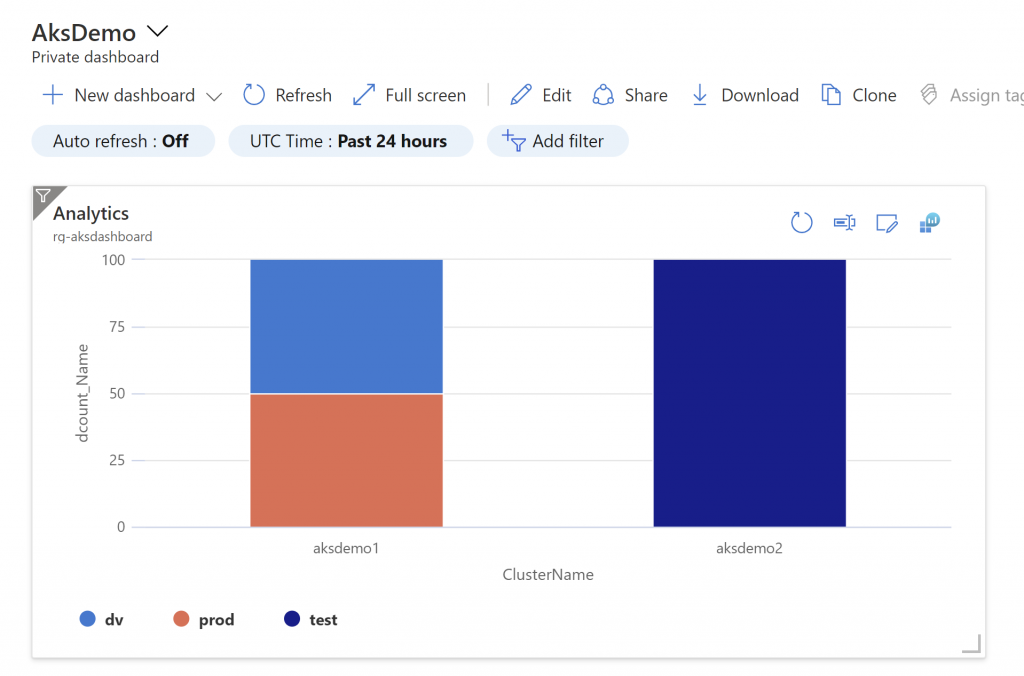
Create an Azure Dashboard panel with this output by clicking on [Pin to dashboard] button.

AIG Demo v/ 
Private dashboard 
New dashboard v 
Auto refresh : Off 
Analytics 
rq-aksdashboard 
CD Refresh Full screen 
UTC Time : Past 24 hours 
aksdemol 
test 
62 Edit Share 
Add filter 
ClusterName 
Download 
aksdem02 
Clone 
e Assign 
z 
o 
100 
75 
50 
25 
dv 
prod

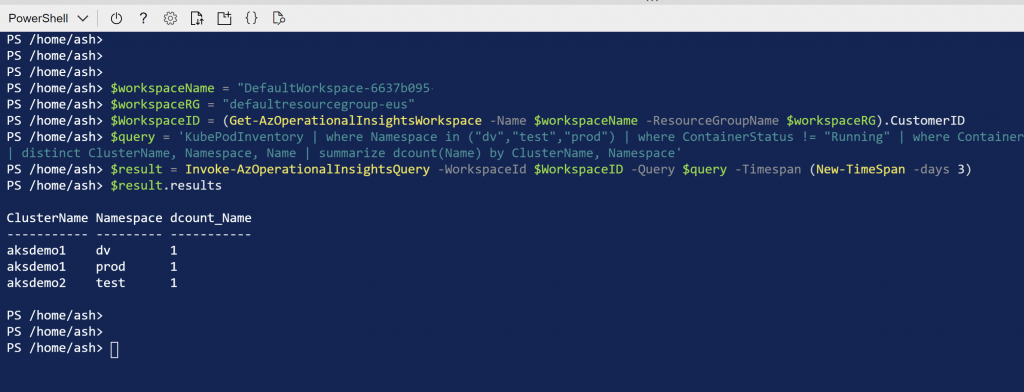
You can also execute this Kusto query directly using powershell.

$workspaceName = "DefaultWorkspace-6637b095-xxxx-xxxx-xxxx-xxxxxxxxxxx-EUS" 
$workspaceRG = "defaultresourcegroup-eus" 
$WorkspaceID = (Get-AzOperationalInsightsWorkspace -Name $workspaceName -ResourceGroupName $workspaceRG).CustomerID 

$query = 'KubePodInventory | where Namespace in ("dv","test","prod") | where ContainerStatus != "Running" | where ContainerStatusReason !in ("", "Completed") | distinct ClusterName, Namespace, Name | summarize dcount(Name) by ClusterName, Namespace' 

$result = Invoke-AzOperationalInsightsQuery -WorkspaceId $WorkspaceID -Query $query -Timespan (New-TimeSpan -days 1) 
$result.results 

This allows you to include the results of your custom Kusto queries in any reports you might run using Azure Automation Runbooks.

PowerShell v Q) 
PS /home/ash> 
PS /home/ash> 
PS /home/ash> 
Q 
o 
PS /home/ash> $workspaceName 
"DefaultWorkspace-6637b095 
PS / home/ash> $workspaceRG 
"defaultresourcegroup-eus" 
PS / home/ash> $WorkspaceID 
(Get-AzOperationa11nsightsWorkspace 
-Name $workspaceName -ResourceGroupName $workspaceRG) . CustomerID 
'KubePodInventory I where Namespace in ("dv" , "test" , "prod") I where ContainerStatus ! = 
"Running" I where Container 
PS / home/ash> $query 
I distinct ClusterName, Namespace, Name I summarize dcount(Name) by ClusterName, Namespace' 
PS / home/ash> $result 
Invoke-AzOperationa11nsightsQuery -Workspaceld $WorkspaceID -Query $query -Timespan (New-TimeSpan 
-days 3) 
PS / home/ash> $result.results 
ClusterName Namespace dcount_Name 
aksdemol 
aksdemol 
aksdem02 
dv 
prod 
test 
1 
1 
1 
PS / home/ash> 
PS / home/ash> 
PS /home/ash>

AKS Supported Kubernetes Versions

Azure Kubernetes Service (AKS) supports specific versions of Kubernetes.
It is necessary to regularly monitor the release of new versions and upgrade your AKS clusters to supported versions in order to remain in compliance with AKS Kubernetes Version Support Policy.

AKS announces the planned date of a new minor version release and corresponding old version deprecation via AKS Release notes at least 30 days prior to removal. An email notification is sent to the subscription administrators with the planned version removal dates. You get 30 days from version removal to upgrade to a supported minor version release. Patch versions can be released anytime and you get 30 days from the removal date to upgrade to a supported patch version.

You should test new target Kubernetes versions and upgrade your AKS clusters in a timely manner. For that, it is necessary to proactively monitor the AKS release notes. This can easily become a chore in a large Enterprise environment. Here is a Powershell script to make it easier to stay on top of Kubernetes version releases in AKS and publish/share it with others: Get-AksSupportedVersions.

$aksVersionsJson = az aks get-versions --location eastus

$aksVersions = $aksVersionsJson | ConvertFrom-Json
$aksVersions.orchestrators.upgrades.orchestratorVersion 

$data = $aksVersions.orchestrators | Select-Object `
    -Property @{Name="Version";Expression={$_.orchestratorVersion}} `
            , @{Name="Default";Expression={$_.default}} `
            , @{Name="Preview";Expression={$_.isPreview}} `
            , @{Name="Upgrades";Expression={$_.upgrades.orchestratorVersion -join ", "}}

$versionTable = $data | ConvertTo-Html -Fragment 
$versionTableString = $versionTable | Out-String
$html = New-Object -ComObject "HTMLFile"
$html.IHTMLDocument2_write($versionTableString)
$tables = $html.body.getElementsByTagName("table")

$rptString = ""
ForEach($table in $tables){
    ForEach($row in $table.rows){
            $cellCount = 0
            ForEach($cell in $row.cells){
                $cellCount++
                if(($cellCount -eq 2) -and ($cell.innertext -eq 'True'))
                {
                    $row.className = "OkStatus"
                }
                if(($cellCount -eq 3) -and ($cell.innertext -eq 'True'))
                {
                    $row.className = "WarningStatus"
                }
        }
    }
    $rptString += $table.outerHTML
}

$reportDate = $(get-date -DisplayHint DateTime) | Out-String
$fileTS = $(get-date -Format "yyyyMMdd") 
$fileName = "aks-versions-$fileTS.html"

$rptTitle = "<h1>AKS Kubernetes Versions</h1><p>$reportDate</p>"
$report = ConvertTo-Html -Title "AKS Versions" -Body "$rptTitle $rptString" -Head $header
$report | Out-File "$fileName"

It creates an HTML report of currently supported Kubernetes versions in AKS along with their respective upgrade paths. Here is an example of the report generated by the script referenced above :

AKS Kubernetes Versions

Sunday, November 8, 2020 8:47:42 PM

Version Default Preview Upgrades
1.16.13 1.16.15, 1.17.9, 1.17.11
1.16.15 1.17.9, 1.17.11
1.17.9 1.17.11, 1.18.6, 1.18.8
1.17.11 True 1.18.6, 1.18.8
1.18.6 1.18.8, 1.19.0
1.18.8 1.19.0
1.19.0 True

Reference: How To Create An HTML Report With PowerShell

Using Powershell with Splunk

Splunk Powershell Resource Kit is a convenient and very capable wrapper over Splunk REST API. You can use the Powershell commandlets exposed by this resource kit to deploy, check and manage splunk services as well as execute splunk searches. In this post, you will be introduced to the Splunk Powershell Resource Kit, you will learn how to use powershell commandlets to connect to a splunk instance and execute searches.

1. First, you will need to download the resource kit from github.
2. Installation is very simple. All you have to do is download and extract the files from the zip archive and double click on install.bat to install the splunk powershell module.
3. Open Windows Powershell console from Windows Start menu.
4. Verify that the Splunk module is installed by executing Get-Module commandlet.

Get-Module SplunkSearch

5. Import splunk resource kit commandlets using Import-Module command.

Import-Module -Name Splunk

6. Next, you need to use Get-Credentials and then Connect-Splunk commandlets to connect to splunk. You need to do this once per session or if you need to switch to a different splunk instance.

$credential = Get-Credential
Connect-Splunk -Credential $credential -ComputerName localhost

I have a local Splunk Enterprise instance running on my machine, so I am using localhost as the ComputerName to connect to it. If you have a SplunkCloud subscription you can use YourSubscriptionId.splunkcloud.com as the ComputerName to connect to your subscription. Like so –

Connect-Splunk -Credential $credential -ComputerName MySubscription.splunkcloud.com

7. Next, use Search-Splunk commandlet to execute searches –

Search-Splunk -Search "Error"

Here is a sample script:

$lastDay = ( get-date ).addDays( -1 ).toString( ‘s’ )

$searches = @(
    "ERROR"
    , "source=""tutorialdata.zip:*"" ERROR"
    , "CreditDoesNotMatch"
    ,"source=""tutorialdata.zip:.\\www3/access.log"" productId=WC-SH-G04"
)

Write-Output $lastDay
foreach($search in $searches)
{
    $qry = $search + " | stats count"
    Write-Output $qry
    Search-Splunk -Search $qry -StartTime $lastDay | Select-Object -ExpandProperty Count
}

The sample script executes multiple Splunk searches and outputs the count of results matching these search queries. Note that I am “-StartTime” parameter to scope the search to a narrower time window and “stats count” command to get the count of results. You can get this sample script as a github gist.

You can also use -EndTime and –MaxReturnCount to further constrain the query results and Format-List, Format-Table, Format-Wide commands to format the results. You can learn more about other Search parameters as well as other capabilities exposed in the resource kit documentation.

Resources :

  1. Splunk Powershell ResourceKit
  2. Splunk Powershell ResourceKit on github
  3. Splunk Powershell ResourceKit Documentation

Image credit : terminal by Andrea Mazzini from the Noun Project

Code Validation in TortoiseSVN pre_commit_hook

If you want to abort a commit if your code fails certain rule and you don’t have access to the SVN Server to configure a hook. What do you do ?

Assuming you are using TortoiseSVN, you can configure a Client-Side hook.

Here is an example – Say you want to abort commit if you have a comment in your code that starts with //Do Not Commit. You can create a PowerShell script that validates all the files in your changeset and use this script as a Client-Side pre_commit_hook in TortoiseSVN.

TortoiseSVN-Settings-HookScripts

The pre_commit_hook configuration :

Configure-Hook-Scripts

//Powershell script : pre_commit.ps1

$donotcommit = “//Do Not Commit“;

$changeset = Get-Content $args[0];

foreach($file in $changeset)
{
if( Get-Content $file | Select-String $donotcommit -quiet )
{
Write-Error$file contains code that you are not supposed to commit. [$donotcommit]“;
exit 9;
}
}

Now, if your changeset has a file with a comment starting with //Do Not Commit and you click on OK to commit this change, the commit will be aborted with this error message –

pre_commit_hook-validation