OpenflowSight is a Streamlit application for searching, filtering, and analyzing Openflow telemetry data, inspired by Azure App Insights Search UX.
It’s a log explorer focused on Openflow telemetry. It helps you quickly identify relevant events, see when they spiked, and which processors were involved. Search, group similar events, and export results for deeper offline analysis.
Openflow is an exciting new unified data integration tool from Snowflake based on Apache NiFi. Logs, traces, and metrics emitted at runtime are written to the Event table which supports the OpenTelemetry data model. OpenflowSight surfaces this data to enable convenient, efficient monitoring and analysis of Openflow operations from a graphical dashboard—instead of using SQL queries.
Key Features
- Runtime Filtering — Select multiple runtimes, toggle system runtimes, filter by processor and log level
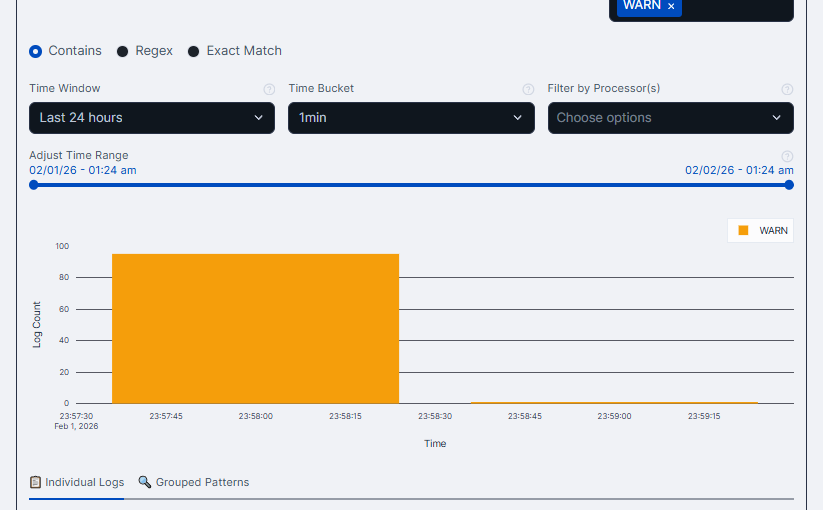
- Smart Search — Multi-term search (comma-separated) with contains, regex, and exact match modes
- Timeline View — Interactive histogram with zoom/pan, configurable time buckets (1 min to 1 hour), preset windows (1h/6h/24h/7d)
- Grouped Patterns — Fuzzy clustering that normalizes dynamic values (timestamps, UUIDs) for accurate pattern grouping
- Individual Logs — Excel-like grid with sorting, filtering, pagination, and multi-select
- CSV Export — One-click export with smart file naming
Tech Stack
Open Source
OpenflowSight is open-source and contributions are welcome—features, fixes, docs, anything. If it helps you debug Openflow pipelines faster, that’s a win.